


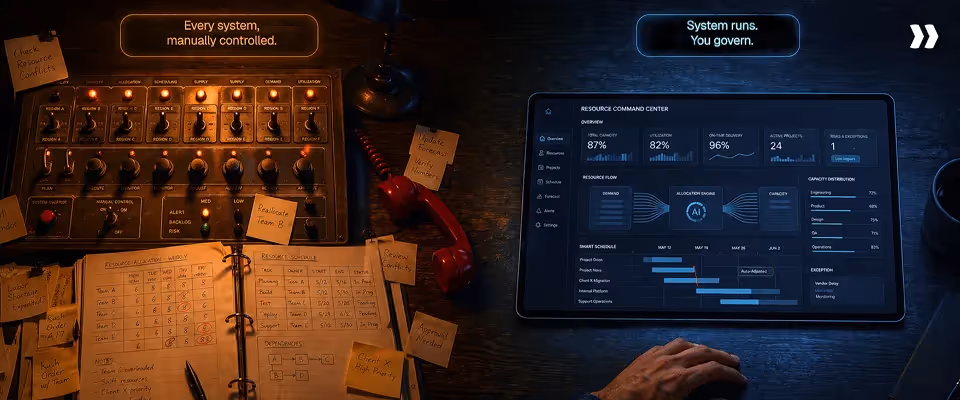
Some consultants carry unsustainable workloads while others wait for assignments.
This imbalance does not stem from a demand shortage. It stems from the absence of a system that continuously aligns capacity with project demand.
When staffing decisions depend on tribal knowledge and weekly calls, overallocation and underutilization coexist in the same organization.
Why resource plans fail without real-time visibility
A resource plan built on Monday loses accuracy by Wednesday. Customers reschedule. Consultants submit PTO. Scope expands.
Static plans cannot absorb these changes. Most allocation problems originate from a visibility gap, not a people gap. The resources and hours exist. No one can see them in the context of everything else happening across the portfolio.
Business impact
Uneven workload distribution produces three compounding effects. Overloaded consultants miss deadlines and trigger escalations. Underutilized team members represent billable hours that never convert to revenue.
Delivery leaders lose the ability to forecast staffing needs because the data underneath their plans no longer reflects reality.
Why resource leveling matters now: the cost of getting it wrong

Resource leveling is a financial control, not a planning preference. When workloads stay misaligned with capacity, the cost shows up in two places simultaneously: lost revenue from underutilized consultants and delayed delivery from overloaded ones.
This misalignment can lead to missed project deadlines, delays in project completion, and compromised project outcomes, all of which are common results of poor resource leveling.
1. Revenue impact of underutilization
A 100-person services team billing at $150 per hour generates approximately $600,000 of weekly capacity.
A 10% utilization gap, the kind that hides inside spreadsheets and surfaces only during quarterly reconciliation, results in $60,000 of lost revenue per week. That exceeds $3 million annually.
The gap is not caused by a lack of demand. It is caused by project managers staffing the consultants they know, while others with matching skills sit underbooked. Without a system that surfaces available capacity, this pattern repeats every staffing cycle.
2. Overutilization and delivery risk
Sustained overutilization, or resource overallocation, degrades delivery before it shows up in a report. Deadlines slip. Escalations increase. Customer satisfaction declines.
Burnout drives turnover, and replacing a senior consultant costs 3 to 6 months of recruiting and ramp time. Resource overallocation not only increases delivery risk but also undermines a healthy work-life balance for team members, as excessive workloads and overtime can lead to stress and reduced personal time.
A team billing 95% of available hours looks efficient on a dashboard. In practice, that team is one PTO request away from a cascade of missed commitments across every project those consultants touch.
Why sustained high utilization increases delivery risk
Sustained utilization above 90% compresses the margin for error to near zero. Every scope change or unplanned absence lands on a team with no buffer.
High-performing organizations target 70 to 85% billable utilization deliberately. These targets help balance workloads and promote efficient resource utilization.
The remaining capacity absorbs variability: scope changes, unplanned customer requests, internal enablement, and the coordination overhead that every multi-project environment generates.
What is resource leveling in project management (and services context)

Resource leveling is the practice of adjusting project schedules and workloads through the resource leveling process, which addresses resource constraints and resource availability to optimize resource usage.
This ensures that resource demand never exceeds available capacity, resulting in balanced utilization and predictable delivery across concurrent projects.
Definition in project management
In project management, resource leveling is a project management technique recognized by the Project Management Body of Knowledge (PMBOK) Guide.
It resolves scheduling conflicts within a single project by optimizing the project schedule. A project manager identifies a double-booked developer, shifts a task start date, or reassigns the deliverable.
The goal is a feasible schedule where no resource is overcommitted. This version of leveling resets when the project closes.
Definition in professional services
In services environments, resource leveling operates continuously across multiple projects, dynamically adjusting to changes in demand, scope, and team availability. Three layers of complexity separate it from single-project leveling:
Resource leveling in professional services is an ongoing operational system, not a one-time scheduling adjustment.
Capacity formula
The foundation of resource leveling is an accurate calculation of resource capacity. Most teams get this wrong by treating total work hours as available capacity, but true resource capacity must account for all factors that reduce actual availability.
Available Capacity = Total Work Hours - PTO - Holidays - Non-billable Commitments
Every allocation decision built on the 40-hour number overcommits that person by 100%. Non-billable commitments include team meetings, training, administrative work, and mentoring. These hours are real. Excluding them creates a fictional version of resource capacity and availability that breaks the moment it contacts execution. Monitoring and optimizing resource capacity is essential for effective resource leveling and project management efficiency.
Why incomplete capacity calculations lead to failed plans
Capacity calculations that exclude PTO or internal work create plans that look balanced on paper and fail during execution. Resource leveling systems that do not integrate with HRIS (Human Resource Information System) platforms produce unreliable outputs. The leveling math is only as good as the capacity inputs feeding it.
Resource leveling example in project management: step-by-step scenario
Resource leveling becomes tangible when you walk through the math. This scenario provides resource leveling examples and demonstrates how project tasks are managed to resolve conflicts.
It reflects a pattern that surfaces weekly in services organizations managing concurrent engagements.
Scenario: multi-project overallocation
Priya is a senior technical consultant assigned to three active projects in one week:
This is a classic case of resource overallocation, where the same resources are scheduled across multiple projects without coordination. No single project manager created this problem. Each allocated Priya based on her skills and their individual timeline without visibility into the other two.
Identifying the imbalance
A utilization heat map surfaces the conflict. Monitoring resource utilization is key to identifying imbalances. Priya’s current week shows red. The following two weeks show open capacity after Project B wraps. Meanwhile, two other consultants with matching qualifications sit at 45% and 50% utilization. The imbalance is a visibility gap, not a staffing shortage.
Rebalancing actions
Result: Priya drops from 75 to 40 hours. Raj moves to 70%. Meera moves to 75%. No deadline changes. No customer impact.
Before vs. after comparison
What this means
The total hours across all three projects did not change, and the project completion date was maintained even as workloads were redistributed. The people doing the work shifted based on availability and skills.
Revenue stayed the same. Risk dropped. Three consultants moved closer to the 70 to 85% target instead of one absorbing unsustainable load while two waited for assignments.
Resource leveling vs. allocation vs. smoothing vs. critical path

Four terms dominate resource planning conversations. They describe different activities, solve different problems, and operate at different points in the project lifecycle.
Conceptual differences
- Resource allocation answers: who is doing this task? It does not evaluate whether the person has the capacity for the assignment alongside other commitments.
- Resource leveling answers: Can this person handle this assignment, given everything else on their plate? It adjusts the project schedule and project deadlines as needed, redistributes tasks, or shifts timelines to create realistic project deadlines.
- Resource smoothing answers: Can we redistribute effort within the existing timeline? It moves work into slack periods but cannot extend deadlines.
- Critical path method answers: What is the longest chain of dependent tasks? It identifies which tasks have zero scheduling flexibility.
Practical implication
Confusing these concepts produces a specific failure. A delivery leader sees every consultant allocated and concludes the team is fully utilized. In reality, three carry 120% workloads while four sit at 40%. Allocation looks complete, but resource constraints and conflicts remain unresolved. Leveling was never performed.
Applying smoothing to a problem that requires leveling wastes planning effort. Smoothing works within a single project with scheduling slack. It cannot resolve resource constraints, such as five projects competing for the same specialist in the same week.
The real problems resource leveling solves
Resource leveling addresses three operational failures that compound when left unmanaged. First, overallocation of resources can lead to project delays if not properly managed.
Effective resource leveling helps prevent these delays by ensuring that the project team is not overburdened and can work efficiently toward timely project completion. Second, the underutilization of resources wastes valuable capacity. Third, inconsistent workloads can cause burnout or disengagement.
Overallocation and delivery delays
Resource overallocation causes overloaded resources to deliver late on every project they touch, often resulting in missed project deadlines. Missed deadlines trigger escalations. Escalations consume management time. Quality drops.
Customer satisfaction declines. The cascade also drives attrition: consultants carrying unsustainable workloads for months leave, and replacing them costs 3 to 6 months of ramp time.
Underutilization and revenue leakage
Idle capacity reduces billable utilization and directly impacts revenue. For a 50-person team billing at $150 per hour, every utilization point below target costs approximately $3,000 per week. The root cause is not a lack of demand.
Project managers and staff consultants know, concentrating work on a subset of the team. Without a system that surfaces available capacity, this pattern self-reinforces.
Forecasting gaps
Lack of visibility into demand and capacity results in reactive hiring. Delivery leaders cannot answer: Do we have enough senior consultants for deals closing next month? When do we start recruiting for Q3?
Proactive organizations forecast 3 to 6 months ahead by combining project allocations with CRM pipeline data, separating confirmed from tentative demand.
Why accurate capacity data drives reliable utilization
A utilization dashboard reporting 75% is meaningful only if the capacity denominator reflects real resource capacity and availability.
Plans built on inflated numbers overcommit the team. Accurate data on resource capacity requires integration between the resource planning system, the HR platform, and the project execution layer.
Steps in resource leveling: the 5-step control system

Resource leveling follows five steps executed in sequence and repeated continuously: model capacity, map demand, detect imbalances, rebalance workloads, and update plans.
Treating these as a one-time exercise produces a plan that degrades within days. Treating them as a control loop produces a system that keeps utilization aligned as conditions change.
- Capacity modeling: Capacity reflects actual availability after accounting for PTO, holidays, and non-billable commitments. A consultant on a 40-hour week with 4 hours of meetings and 1 day of PTO has 28 hours of available capacity, not 40. Capacity models must update automatically. A PTO approval on Tuesday should reduce available hours by Wednesday morning.
- Demand mapping: Demand includes both active projects and pipeline work, categorized into confirmed and tentative allocations. Project plans provide confirmed demand. CRM pipeline data provides tentative demand. Soft allocations reserve capacity for pipeline work without locking it. Ignoring pipeline demand creates surprises when deals close. Treating it as confirmed overcommits resources against revenue that may not materialize.
- Imbalance detection: Utilization thresholds identify underutilization below 60% and risk zones above 90%. Detection scans two dimensions: individual utilization (which consultants are outside the target range?) and role-based capacity (does the organization have enough people in each role for forecasted demand?). A heat map makes both visible at a glance.
- Workload rebalancing: Tasks are redistributed through three actions, often involving adjustments to start and finish dates, including the project start date and project end date, to ensure resource availability aligns with the project finish date: Each action changes the capacity picture. The system recalculates utilization after every adjustment, confirming the rebalancing resolved the imbalance without creating a new one.
- Continuous updates: Resource plans are continuously updated to reflect changes in project scope, staffing, and availability. Project timeline changes propagate to allocations automatically. PTO approvals reduce capacity in real time. Pipeline movement updates tentative allocations before deals close.
Decision Block
- Shift timelines when deadlines are flexible, and the task falls outside the project's critical path.
- Reassign work when another team member holds the required skills and has capacity in the same period.
- Hire when sustained demand exceeds capacity for 8+ consecutive weeks, and no rebalancing action closes the gap.
Why resource leveling must operate as a continuous control system
Resource leveling functions as a continuous control system rather than a one-time planning activity. The variables it manages change daily. Organizations that run leveling as a continuous loop detect imbalances within days. Organizations that run it periodically discover problems weeks after the damage compounds.
Resource leveling techniques: execution-level detail
Three techniques form the operational backbone of resource leveling in professional services. Teams apply resource leveling techniques as part of the resource leveling process to optimize resource utilization.
Each technique solves a different allocation failure. Used together, they keep utilization within target ranges while maintaining delivery quality.
1. Load balancing
Work is assigned to the least utilized qualified resource to maintain balanced utilization. This approach is crucial for balancing resources and balancing workloads, both of which are essential for sustainable project delivery.
It counters the most common allocation pattern: project managers defaulting to consultants they know regardless of workload. A real-time utilization view ranks qualified resources by available capacity. Instead of three consultants at 110% while five sit at 40%, the team converges toward the 70 to 85% target range.
2. Skills-based allocation
Tasks are matched with resources based on expertise to maintain quality and efficiency. Load balancing optimizes for capacity. Skills-based allocation optimizes for fit. Filter by skill first, then rank by availability.
A skills matrix tracks certifications, domain expertise, product knowledge, and past performance. Identifying key resources, those critical assets or personnel essential to maintaining workflow and preventing delays, is crucial. A consultant at 40% utilization who lacks the required certification creates more rework than a consultant at 70% who holds the right expertise. Capacity without capability is not real availability.
3. Capacity buffers
Reserved capacity absorbs unexpected demand and prevents overcommitment, especially when dealing with limited resources and resource constraints.
A team targeting 80% utilization reserves 8 hours per person per week as a buffer for scope changes, unplanned requests, and coordination overhead, helping to manage resource constraints and ensure that limited resources are not overextended.
The common mistake is treating buffer capacity as idle capacity and staffing against it. When leadership sees 20% “unused” capacity and assigns more work, they eliminate the buffer that kept delivery predictable.
Buffers are the structural margin between sustainable pace and a team one PTO request away from a delivery crisis, particularly important when resource constraints and limited resources are factors.
Why most teams fail at resource leveling

Most teams understand resource leveling. Few execute it consistently. The failure is not conceptual. It is structural. Three root causes break leveling processes within the first month, regardless of how well the team understands the theory.
Relying solely on spreadsheets often leads to errors and inefficiencies, whereas using project management tools and project management software can help automate and optimize resource leveling, making it easier to visualize schedules, manage resources, and track progress.
Reliance on spreadsheets
Manual tools lack real-time updates and cannot scale with team size. A spreadsheet-based resource plan requires someone to open the file, update allocations, and reconcile conflicts by hand.
Manual tracking of resource usage in spreadsheets is inefficient and prone to errors, especially as project complexity increases. At 10 concurrent projects, that takes hours per week. At 30+, the lag between reality and the spreadsheet grows every day.
The spreadsheet also creates a single-editor bottleneck. One resource manager updates the file.
Every project manager who needs staffing information either waits for a response or makes decisions without current data. By the time the spreadsheet reflects this morning’s changes, three new allocation decisions have already been made against yesterday’s numbers.
Disconnected systems
Project planning, resource allocation, and capacity tracking exist in separate systems. The project plan lives in one tool. Resource allocation lives in a spreadsheet or a different platform. PTO data lives in the HRIS. Time tracking lives somewhere else.
When a project timeline shifts by two weeks, the resource allocation does not update automatically. When a consultant submits PTO, the capacity plan does not reflect it until someone manually adjusts the numbers. When a new project enters the pipeline, delivery leaders check a CRM that does not connect to the staffing view.
Each disconnection creates a gap where allocation decisions are made against incomplete data. Three disconnected systems do not produce three small errors. They produce compounding inaccuracy across every project that shares resources.
Static planning
Plans become outdated the moment conditions change, and conditions change daily. A customer reschedules a milestone.
A consultant gets pulled into an escalation on another account. A deal closes two weeks ahead of forecast. Each shift invalidates a portion of the resource plan that was accurate when it was built.
Static plans fail because professional services environments generate more change per week than any periodic planning cycle can absorb.
A plan reviewed on Monday reflects Monday's reality. By Thursday, three variables have shifted. The team operates on Thursday with Monday's data and discovers the mismatch the following Monday.
Why disconnected plans fail during execution
Plans that are not connected to execution systems become inaccurate almost immediately. The resource plan says a consultant is 60% allocated.
The project plan shows 40 hours of work due this week. The HRIS shows 2 days of approved PTO that no one entered into the staffing spreadsheet.
The consultant's real available capacity is 16 hours, not the 24 hours the plan assumes.
This is not an edge case. It is the default state of every organization where resource planning, project execution, and HR data live in separate systems.
The plan and reality diverge at a rate proportional to the number of active projects and people in the system.
The fix is not better spreadsheets or more frequent manual updates. The fix is a single system where project timelines, resource allocations, capacity data, and time-off records update the same data layer.
When a project phase shifts, allocations shift with it. When PTO is approved, capacity recalculates automatically. When a deal moves to closed-won in the CRM, a tentative allocation converts to confirmed without anyone opening a spreadsheet.
Transition
The teams that solve these structural problems do not work harder at planning. They work inside systems that keep leveling data current without manual reconciliation.
What best-in-class teams do differently
The teams that maintain 70 to 85% utilization across quarters do not have better project managers or fewer variables to manage. Instead, they achieve efficient resource utilization and superior project outcomes by operating inside systems that keep leveling data current and surface decisions before conflicts become escalations. Three capabilities separate them from the average.
Real-time visibility
Teams maintain a live view of capacity, demand, and allocation across all projects. Every project manager sees the same data. Every resource manager works from the same capacity picture. When a consultant's allocation changes on Project A, the impact on Projects B and C is visible in the same session.
This eliminates the most common failure mode: two PMs staffing the same consultant for overlapping milestones because neither knew what the other was doing. Real-time visibility does not prevent every conflict. It prevents conflicts from going undetected for days or weeks.
In practice, delivery leaders at high-performing organizations start their week with a heat map that shows every team member's utilization for the current and next four weeks. Red flags get addressed Monday morning, not discovered Friday afternoon.
Forecast-driven planning
Demand is forecasted several months ahead to align hiring and staffing decisions.
Best-in-class teams do not wait for deals to close before asking whether they have capacity.
They pull pipeline data from the CRM, assign soft allocations based on deal probability, and model capacity against forecasted demand 3 to 6 months out.
This answers the question average teams cannot: "Do we have enough senior consultants for the projects likely to close in Q3?" When the answer is no, hiring starts in Q1, not the week after a deal closes with no one available to staff it.
AI-assisted allocation
Advanced systems recommend optimal staffing decisions based on multiple variables: skills match, current utilization, cost rate, past performance, location, and time zone.
Instead of a resource manager scanning a spreadsheet and selecting a name, the system ranks qualified candidates by the criteria that matter most for the engagement.
Two modes define how leading teams use AI-assisted allocation:
- Load balancing mode: The system prioritizes the least utilized qualified resource, distributing work evenly across the team to prevent concentration on a small group of known consultants.
- Margin optimization mode: The system identifies the lowest-cost resource with matching skills, maximizing project profitability while maintaining delivery quality. Before confirming the assignment, the team sees how each option affects project cost, margin, and capacity.
The shift is not from human judgment to automation. It is from decisions made with partial data to decisions made with full context.
The resource manager still approves every assignment. The system ensures that approval starts from the best available option, not the first name that comes to mind.
How average teams compare to best-in-class
Transition
Knowing what best-in-class teams do differently is the starting point. Measurement frameworks turn those practices into consistent, repeatable performance
Metrics and heuristics that actually matter in resource leveling
Resource leveling produces measurable outcomes. Teams that track the right metrics, such as resource utilization, can catch imbalances within days and ensure that high resource utilization correlates with improved project outcomes.
Teams that track vanity metrics or no metrics discover problems during escalation calls. Three core metrics and three operational heuristics form the measurement system that keeps leveling consistent.
Core metrics
- Utilization rate: The percentage of available capacity spent on billable work. This is the primary indicator of whether leveling is working.
Track utilization at three levels: individual (is this consultant overloaded or idle?), role-based (do we have enough senior architects for current demand?), and team-wide (is the organization hitting its aggregate target?).
Individual utilization hides portfolio problems. Role-based utilization reveals structural gaps.
- Capacity gap: The difference between available capacity and forecasted demand, measured by role and time period. A positive gap means surplus capacity. A negative gap means demand exceeds supply. Track capacity gap on a rolling 13-week view. A gap that appears in week 10 gives the team time to hire, shift timelines, or redistribute work. A gap discovered in the current week leaves no room to respond.
- Forecast accuracy: The percentage of demand forecasted 90 days out that matches actual demand when the period arrives. Low accuracy means the team is planning against numbers that do not reflect reality.
Forecast accuracy improves when pipeline data from the CRM feeds into the capacity model with probability weighting. It degrades when demand forecasts rely on verbal estimates in staffing meetings.
Heuristics
Metrics tell you where you stand. Heuristics tell you when to act. Three operational rules prevent the most common leveling failures.
Heuristic 1: Utilization above 85% for extended periods increases delivery risk.
Two weeks above 85% is a peak. Six weeks above 85% is a staffing failure. Monitor weekly. If any role sustains above 85% for three consecutive weeks, trigger a rebalancing review before the fourth.
Heuristic 2: Allocation variance above 15% requires rebalancing.
Allocation variance measures the spread between the most and least utilized team members in the same role. When one senior consultant runs at 95% while another runs at 55%, the variance signals a load balancing failure.
A 15-point gap is recoverable with a single reassignment. A 30-point gap indicates a systemic visibility problem.
Heuristic 3: Forecast visibility below 90 days increases hiring risk.
If your capacity model cannot project demand and supply by role at least 90 days ahead, hiring decisions will always lag reality.
A requisition opened today takes 60 to 90 days to fill and another 30 to 60 days to ramp. Without 90-day visibility, every new hire arrives after the capacity crunch has already caused delivery damage.
Transition
When these metrics flash warning signals or these heuristics trigger repeatedly, the resource leveling system needs structural attention, not incremental fixes.
When to fix resource leveling: trigger points

Resource leveling does not break all at once. It degrades gradually, and teams compensate with workarounds until the workarounds themselves become the process. One key trigger for fixing resource leveling is when teams can no longer resolve resource conflicts efficiently. Three trigger points signal that the leveling system needs structural repair, not another spreadsheet update.
Trigger 1: Simultaneous overutilization and idle capacity
This is the clearest signal. Some consultants run above 90% for consecutive weeks while others in the same role sit below 50%. Both conditions exist at the same time, in the same team, because no one has a consolidated view of who is working on what.
When you see this pattern, the problem is not workload volume. The problem is workload distribution. Demand exists. Capacity exists. The system connecting them is broken or missing.
What to check: Pull utilization by person for the past 4 weeks. Sort by role. If the spread between highest and lowest utilization within the same role exceeds 30 percentage points, the leveling system is not functioning.
Trigger 2: Frequent delivery escalations tied to staffing
Escalations happen for many reasons. When escalations repeatedly trace back to the same root causes, overbooked consultants missing deadlines, last-minute resource swaps, or key people unavailable during critical project phases, the issue is upstream in the leveling process.
One escalation is an incident. Three escalations in a quarter with staffing as a contributing factor is a pattern. Five is a system failure.
What to check: Review your last 90 days of escalations. Tag each with the root cause. If 40%+ involve resource conflicts, overallocation, or unplanned coverage gaps, the leveling process is the bottleneck.
Trigger 3: Inability to forecast staffing needs
When delivery leaders cannot answer "Do we have capacity to start a new project next month?" without spending hours pulling data from multiple systems, the forecasting layer of resource leveling has failed.
This trigger often surfaces as reactive hiring. The team runs hot for 6 weeks before anyone approves a new requisition. The new hire takes 90 days to recruit and 60 days to ramp. By the time they contribute, the original crunch has either resolved or caused enough delivery failures to lose a customer.
What to check: Ask your resource manager how long it takes to produce a capacity forecast by role for the next 90 days. If the answer is "a few hours" or "I would need to check with each PM," the forecasting system is manual and unreliable.
How to read the triggers together
Any single trigger warrants investigation. Two concurrent triggers indicate structural breakdown. All three together mean the team is operating without a functioning leveling system, regardless of what tools or processes are nominally in place.
Transition
These triggers share a common upstream cause: limitations in the tools and processes that resource leveling depends on.
Why your current process or tool is breaking

The triggers described above, coexisting overutilization and idle capacity, recurring staffing escalations, and inability to forecast, all trace back to one structural limitation.
Manual systems cannot synchronize changes across projects, project resources, and timelines in real time.
When data streams are disconnected, project resources must be managed holistically to avoid breakdowns and ensure effective resource leveling.
Structural limitation
Resource leveling requires four data streams to stay synchronized: project timelines, resource allocations, team capacity (including PTO and non-billable commitments), and pipeline demand. In most organizations, each stream lives in a different system.
Each disconnection produces a specific failure. A project phase shifts by two weeks, but the resource plan still shows the original dates. A consultant's PTO is approved in the HR system, but the capacity spreadsheet still counts those days as available. A deal moves to closed-won on Thursday, and the delivery team learns about it Monday with no one available to staff it.
These are not edge cases. They are the default operating state of every organization where resource data is distributed across 3 to 5 tools that do not share a data layer.
The root problem is not the quality of any individual tool. Smartsheet is capable. Salesforce is capable. BambooHR is capable.
The problem is that none of them update each other. The resource manager becomes the human integration layer, manually reconciling data across systems that were never designed to stay synchronized.
At 10 concurrent projects, manual reconciliation is tedious but survivable. At 30+, the reconciliation effort exceeds the value it produces. Data is stale before the spreadsheet is saved. Allocation decisions are made against capacity numbers that stopped being accurate two days ago. The leveling process exists on paper. It does not function in practice.
Common Mistake vs Right Approach
Common Mistake: Plan resources in spreadsheets and update allocations during weekly staffing calls. Between calls, project managers make staffing decisions independently, creating conflicts that surface only when deadlines break or consultants report burnout.
Right Approach: Operate resource leveling inside a single system where project timelines, allocations, capacity, and pipeline data share one data layer. Changes propagate automatically. Organizations using integrated resource management report 30 to 50% reduction in administrative overhead spent on manual reconciliation and allocation coordination.
Resource leveling software: what to look for
The structural problems described above, disconnected systems, stale data, manual reconciliation, are not solved by simply adding another tool to the stack. Instead, they are addressed by replacing the stack with a platform where project delivery, resource management, and capacity data share one data layer.
Project management software and project management tools are essential for effective resource leveling, as they help visualize project schedules, manage resources, and track progress. Five capabilities separate resource leveling software that works from tools that add complexity without solving the core problem.
1. Real-time visibility
A unified view of capacity, allocation, and demand across all projects. Every project manager and resource leader sees the same data in the same session. When a consultant's allocation changes on one project, the impact on every other project that person touches is visible immediately.
- What good looks like: A heat map showing every team member's utilization for the current and next 4 to 12 weeks, color-coded by capacity status, filterable by role, team, region, and skill.
- What to avoid: Tools that show allocation per project but require opening each project separately to see a person's total workload. Per-project views hide the cross-project conflicts that resource leveling exists to solve.
2. Scenario planning
Ability to simulate staffing changes and forecast outcomes before committing.
When a delivery leader considers shifting a consultant from Project A to Project B, the system should show the impact on both projects, on the consultant's utilization, and on the financial margin of each engagement.
- What good looks like: A what-if view where swapping one resource for another updates utilization, cost, and margin numbers in real time. The team sees the tradeoff before making the assignment.
- What to avoid: Tools where testing a staffing change requires making the change, checking the result, and then undoing it if the outcome is unfavorable. Trial-and-error staffing is not scenario planning.
3. Integrated data
Connection between project delivery, resource management, and financial tracking in one platform.
Project timeline changes propagate to resource allocations automatically. PTO approvals from the HRIS reduce available capacity without manual entry. Pipeline opportunities from the CRM create tentative demand that delivery leaders can plan against.
- What good looks like: A single system where shifting a project phase by two weeks automatically updates every resource allocation tied to tasks in that phase, recalculates utilization for every affected person, and flags any new conflicts.
- What to avoid: Tools that require manual sync between project plans and resource plans. Any system where "update the resource sheet" is a task someone performs after changing the project timeline is a system that will drift from reality within days.
4. Soft and hard allocations
Ability to distinguish between confirmed work on signed projects and tentative demand on pipeline opportunities. Soft allocations reserve capacity without locking it. Hard allocations represent committed staffing.
- What good looks like: Visually distinct allocation types. Soft allocations (wavy pattern or lighter shade) for pipeline projects. Hard allocations (solid blocks) for active work. A capacity view that shows both so delivery leaders can forecast against total expected demand.
- What to avoid: Tools that treat every allocation as confirmed. Without soft allocations, teams either ignore pipeline demand (and get surprised when deals close) or overcommit additional resources against revenue that may not materialize.
5. Skills-based filtering
Ability to search more resources by skill, certification, domain expertise, location, and time zone. When staffing a new project, the system narrows the pool to qualified candidates before sorting by availability.
- What good looks like: A searchable skills matrix integrated with the allocation view. Filter for "Salesforce CPQ certified, EMEA time zone, available 20+ hours in weeks 14-18" and get a ranked list of matching consultants sorted by current utilization.
- What to avoid: Tools where skills data lives in a separate spreadsheet or HR system. If the resource manager must check one system for skills and another for availability, every staffing decision requires two lookups and manual cross-referencing.
Decision Block
Systems lacking real-time visibility, scenario planning, and integrated data create blind spots in resource planning that no amount of manual effort can compensate for. The question is not whether your team needs these capabilities. The question is at what project volume the absence of these capabilities starts costing more than the platform that provides them.
Tools like Rocketlane unify project delivery, resource management, and financial tracking in one platform, enabling professional services teams to move from spreadsheet-based staffing to system-driven resource leveling that targets 70 to 85% billable utilization across the portfolio.
Transition
The next evolution of resource leveling moves beyond integrated platforms into AI-assisted decision-making, where systems do not wait for humans to detect imbalances but surface recommendations and execute adjustments automatically.
The modern approach: AI + integrated resource management

Integrated platforms solve the data problem. AI solves the decision problem. A unified system that connects project timelines, capacity, and pipeline data gives the team accurate information.
AI-assisted resource management enables efficient resource utilization by turning information into recommended actions, reducing the time between detecting an imbalance and resolving it from days to minutes.
Shift from manual to automated planning
Traditional resource leveling follows a human-driven sequence. A resource manager reviews the capacity spreadsheet, identifies a conflict, evaluates options, selects a reassignment, and updates the plan. Each step takes time. At 30+ concurrent projects, the queue of leveling decisions exceeds what one person can process in a weekly staffing cycle.
AI-assisted resource management changes the sequence. The system continuously analyzes capacity and demand across every active and pipeline project. When an imbalance emerges, the system surfaces it with context: who is overallocated, by how many hours, on which projects, and which qualified team members have capacity in the same period. Instead of discovering and diagnosing the problem, the resource manager starts at the decision point.
Three capabilities define what AI adds to resource leveling beyond what an integrated platform provides alone.
- Intelligent ranking: When a project needs staffing, the system does not present an alphabetical list of consultants. It ranks candidates by skills match, current utilization, cost rate, past performance on similar engagements, and time zone alignment. The resource manager sees the best option first, not the first name in the directory.
- Proactive conflict detection: The system does not wait for someone to open a dashboard and notice a problem. When a new allocation pushes a consultant above 90%, when approved PTO conflicts with a project milestone, or when a closing deal will require a role that is already at capacity, the system surfaces the conflict and suggests resolution options.
Capacity forecasting: AI models projected demand against available supply by role for the next 3 to 6 months. When forecasted demand exceeds supply for a specific role in a future period, the system flags the gap with enough lead time to hire, shift timelines, or redistribute work before the crunch arrives.What this means
Resource leveling transitions from reactive coordination to proactive optimization. The resource manager's role shifts from data collector and conflict detective to decision-maker and strategic planner.
The hours previously spent reconciling spreadsheets, chasing PMs for allocation updates, and manually scanning for conflicts redirect toward higher-value work: workforce planning, skills development, and delivery strategy.
The shift is not theoretical. Professional services teams using AI-assisted resource management report staffing decisions that previously took hours completing in minutes, with allocation recommendations that account for more variables than a human reviewer can process simultaneously.
Transition
This shift from manual coordination to AI-assisted optimization is fully realized in platforms designed for modern professional services teams, where project delivery, resource management, and financial tracking operate inside one system with an intelligence layer that acts on the data continuously.
How Rocketlane + Nitro transforms resource leveling
What Rocketlane is
Rocketlane is an agentic AI-powered Professional Services Automation (PSA) platform that unifies project delivery, resource management, and financial tracking into a single system for customer-facing teams. Project timelines, resource allocations, capacity data, time tracking, and customer collaboration share one data layer.
When a project phase shifts, allocations update. When PTO is approved, capacity recalculates. When a deal closes in Salesforce or HubSpot, the delivery team sees it in the same platform where they staff and execute.
This eliminates the structural problem that breaks resource leveling in most organizations: four data streams living in four disconnected tools with a human serving as the integration layer.
What Nitro does
Nitro is the AI layer built into Rocketlane that moves resource leveling from human-driven coordination to system-assisted optimization. It continuously analyzes capacity, demand, skills, cost rates, and project requirements to surface allocation recommendations and automate operational decisions.
Where the core platform provides accurate, real-time data, Nitro acts on that data:
Before vs. after
Operational impact
- Faster staffing decisions: Resource managers stop spending hours scanning spreadsheets and pinging PMs for availability. The system surfaces qualified, available consultants ranked by the criteria that matter for the engagement. Staffing decisions that previously required a full cycle of manual research complete in a single session.
- Balanced utilization across teams: Load balancing mode assigns work to the least utilized qualified resource by default. The pattern of overloading familiar consultants while others sit underbooked breaks because the system makes the imbalance visible before the allocation is confirmed.
- Reduced manual coordination: Project timeline changes propagate to resource allocations automatically. PTO approvals reduce capacity without manual spreadsheet updates. Pipeline movement from the CRM updates tentative allocations without someone entering the data twice. Teams using Rocketlane report 30 to 50% reduction in administrative overhead tied to resource coordination.
Business outcomes
- Improved margins through better utilization: Teams operating inside Rocketlane target 70 to 85% billable utilization with balanced distribution across the team. A 5 to 10 percentage point improvement in utilization translates directly to margin improvement for services organizations where people cost is the primary expense line.
- Faster time-to-value for customers: Projects staff faster because the staffing process takes minutes instead of days. Delivery starts sooner. Balanced workloads mean consultants deliver at sustainable pace without the quality drops that come from overallocation. Customer time-to-value improves by 30 to 50% when delivery operates against accurate capacity data.
- Increased delivery predictability: When resource plans reflect real capacity, project timelines hold. Escalations tied to staffing conflicts decline. Delivery leaders forecast with confidence because the data underneath their commitments updates continuously rather than lagging reality by a week.
Why resource leveling requires system-driven execution at scale
At scale, resource leveling requires system-driven execution rather than manual coordination. A 20-person team managing 15 projects can maintain leveling through weekly calls and spreadsheet discipline.
A 60-person team managing 50+ concurrent engagements cannot. The number of allocation decisions, capacity variables, and cross-project task dependencies exceeds what manual processes can synchronize.
The transition point is not a team size. It is the moment when the time spent maintaining the leveling process exceeds the time the process saves. For most professional services organizations, that threshold falls between 15 and 25 concurrent projects. Beyond that, the system either runs on a platform designed for the complexity, or it runs on good intentions that erode one missed update at a time.
Transition
Resource leveling continues to evolve. The next phase moves from AI-assisted decision support toward autonomous allocation, where systems detect, recommend, and execute leveling adjustments with minimal human intervention.
The future of resource leveling
Resource leveling has moved through three phases: manual spreadsheet coordination, integrated platform-based planning, and AI-assisted decision support. The next phase collapses the gap between detection and action. Systems will not surface recommendations for humans to approve.
They will detect imbalances, evaluate options, and execute rebalancing autonomously within defined guardrails. This shift toward autonomous resource leveling will further improve efficient resource utilization and enhance project outcomes by ensuring optimal allocation and alignment with project goals.
AI-driven optimization
Current AI-assisted systems recommend the best staffing option. A human reviews, approves, and confirms. Future systems continuously adjust allocation based on real-time data without waiting for a review cycle.
When a consultant submits PTO, the system identifies every affected project, evaluates qualified replacements by skills, availability, cost, and past performance, selects the optimal reassignment, and executes it. The resource manager receives a notification of what changed and why, not a request to make the change manually.
This model already operates in adjacent domains. Automated trading systems execute transactions based on predefined rules. Dynamic pricing engines adjust rates in real time. Resource leveling follows the same trajectory: from human-executed to system-executed with human oversight.
Autonomous execution
Autonomous resource leveling does not mean uncontrolled automation. It means execution within boundaries defined by the organization.
A delivery leader sets the rules: utilization targets by role, skills requirements by project type, cost thresholds by engagement tier, and escalation conditions that require human review. The system operates within those boundaries and escalates when a situation falls outside them.
Three conditions make autonomous execution viable for professional services:
- Data integrity: Capacity, demand, skills, and availability data must be accurate and current. Autonomous systems amplify the quality of their inputs. Accurate data produces reliable decisions. Stale data produces faster, bad decisions.
- Defined guardrails: The organization specifies which decisions the system can execute independently and which require approval. Low-risk reassignments within the same role and skill band execute automatically. Cross-team transfers or customer-facing staffing changes route to a human.
- Auditability: Every automated decision includes a record of what changed, why, and which data points informed the action. Delivery leaders review decisions after execution, not before, but with full transparency into the reasoning.
Why resource leveling is becoming an autonomous system
Resource leveling is evolving from a planning discipline into an autonomous operational system because the variables it manages have outgrown human processing capacity.
A 50-person team running 40 concurrent projects with shared resources generates hundreds of allocation decisions per month. Each decision depends on capacity data, skills data, project timelines, PTO calendars, pipeline forecasts, and financial targets that change daily.
No weekly staffing call can process that volume of variables at the speed conditions change. The organizations that reach 80%+ utilization with balanced workloads and predictable delivery in the next 3 to 5 years will be the ones that treat resource leveling as a system that runs continuously, not a meeting that happens weekly.
The shift does not eliminate the resource manager. It redefines the role. Manual coordination and spreadsheet reconciliation give way to policy design, exception handling, and strategic workforce planning. The system handles volume. The human handles judgment.
Conclusion
Resource leveling is not a planning task that gets completed at kickoff and revisited when something breaks. It is a continuous operational system that determines whether a professional services organization hits utilization targets, protects margins, and delivers predictably, or leaks revenue through invisible gaps while burning out its best consultants.
The process is straightforward. Model capacity against real availability. Map demand across active and pipeline work. Detect imbalances before they affect delivery. Rebalance workloads through timeline shifts, reassignments, and work splitting. Update plans continuously as conditions change.
The execution is where most teams fail, not because they lack understanding, but because they lack infrastructure. Spreadsheets cannot synchronize the volume of variables that resource leveling depends on.
Disconnected tools create data gaps that compound with every project added to the portfolio. Manual coordination breaks at the exact moment it matters most: when the organization is growing fast, and every staffing decision carries revenue and delivery consequences.
Organizations that treat resource leveling as a core operational system, supported by integrated data, real-time visibility, and AI-assisted allocation, achieve higher utilization, stronger margins, and more predictable growth. Organizations that treat it as a periodic planning exercise spend their Mondays explaining what went wrong instead of steering what happens next.
Resource conflicts do not announce themselves.
They surface the week a milestone is due, after a commitment was already made against a capacity that did not exist.
Rocketlane connects project delivery, resource management, and capacity data in one platform so professional services teams plan against capacity that is real and staff against availability that updates continuously.


.webp)