


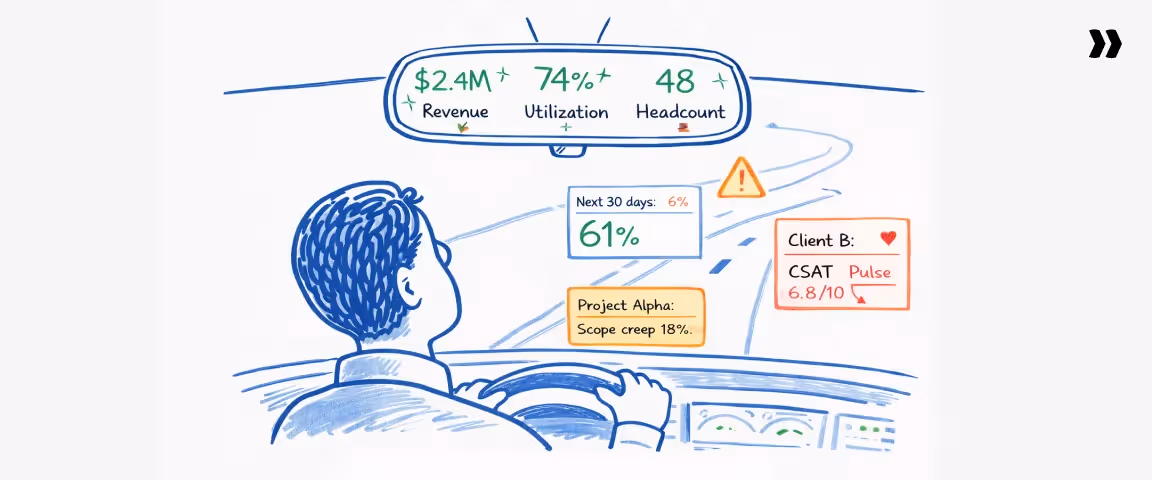
Professional services KPIs often look stable right up until the quarter disappoints.
Revenue appears healthy, utilization rate seems within range, and headcount growth suggests the business is expanding.
And yet, when financial results arrive, project profitability is thinner than expected, delivery teams are underutilized, and pipeline coverage feels suddenly fragile.
The warning signs were already present inside the business; they simply weren't being read early enough.
Most performance issues in professional services (PS) become visible six to eight weeks before they surface in financial results, with early signals appearing in utilization forecasts, pipeline coverage ratios, project profitability on new engagements, and client sentiment during active delivery.
However, most firms rely on lagging indicators like revenue per consultant, quarterly bookings, and utilization rate. By the time those numbers move, the underlying delivery or pipeline problems have typically been developing for weeks.
High-performing firms treat professional services KPIs as an operating system for the business, using agile project management methodologies to revisit targets as conditions shift and leveraging advanced business intelligence software to track key performance indicators and generate actionable reports.
This guide breaks down the full Professional Services Performance Stack, the five layers of professional services KPIs, the benchmarks that matter most, and a practical framework for surfacing delivery, financial, and client signals early enough to influence outcomes.
This matters because tracking KPIs is what separates firms that react to disappointing quarters from those that see them coming.
Why most professional services firms track the wrong KPIs
Most PS firms track KPIs that describe outcomes without capturing the conditions that create them.
Revenue, gross margin, and utilization rate dominate most executive dashboards, functioning as financial scorecards that confirm what has already happened without explaining why.
By the time those numbers shift, leadership teams have typically already felt the impact in the quarter.
Tracking and analyzing sales data is especially important for identifying patterns and measuring the effectiveness of marketing and sales efforts throughout the funnel.
High-performing professional services organizations build KPI frameworks that surface drivers early enough to influence decisions, defining targets by considering historical data, industry standards, and available resources to ensure benchmarks are meaningful guides for improvement.
Analyzing and refining marketing and sales processes is a critical part of this, given their direct impact on key performance indicators such as conversion rates, client retention, and overall revenue growth.
The lagging indicator trap
Revenue growth, gross margin, and utilization rate are results of operational activity, not drivers of performance.
Revenue reflects deals closed weeks or months earlier, gross margin reflects delivery efficiency across projects already completed, and utilization shows how busy consultants were during the reporting period.
None of these numbers show where performance is heading.
The operational signals behind those outcomes appear earlier and in different places.
For instance, utilization forecasts begin slipping in resource management, pipeline coverage narrows in the sales funnel, or project profitability weakens when staffing or scope assumptions drift.
Detecting these signals requires analyzing data from multiple sources, using dashboards or business intelligence software to uncover trends before they reach financial results.
Three patterns commonly appear in firms caught in this trap:
- Leadership dashboards prioritize revenue, margin, and utilization while ignoring delivery signals such as milestone slippage or forecast utilization.
- Pipeline metrics focus on bookings without accounting for coverage relative to delivery capacity.
- Delivery reviews track hours logged without evaluating whether projects are consuming more effort than planned.
Each of these patterns leaves the organization reacting to results instead of steering performance.
Three signs your KPI framework is broken
A weak KPI framework often reveals itself through operational behavior rather than the project metrics themselves.
Sign 1: KPIs only appear at quarterly reviews.
When professional services KPIs surface primarily during quarterly business reviews, they function as retrospective analysis.
Performance metrics that actually influence delivery decisions appear in weekly operating reviews, supported by regular sessions with key stakeholders where KPI data drives timely decisions.
Sign 2: Utilization looks healthy while project overruns climb.
High utilization can mask delivery inefficiencies when consultants remain fully booked on engagements that require more effort than planned or generate lower margins than expected.
Sign 3: Hours are logged but effort is never compared.
Organizations that track hours without measuring planned versus actual effort by phase struggle to detect estimation drift before it compounds.
By the time project profitability problems appear in financial results, the underlying variance has usually been accumulating for weeks.
What fixing it looks like
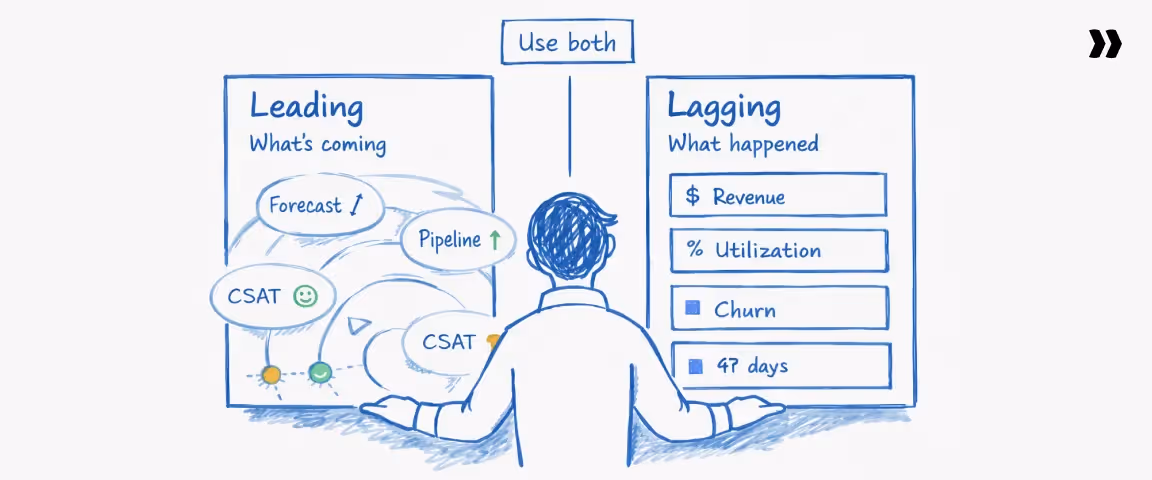
Strong KPI frameworks distinguish clearly between leading and lagging indicators:
- Lagging metrics confirm results, such as revenue, margin, and client churn.
- Leading metrics surface the operational conditions driving those results, including utilization forecasts, pipeline coverage, delivery velocity, and client sentiment signals.
Tracking both layers together on a weekly cadence transforms professional services KPIs from a quarterly scorecard into an operational guidance system.
Involving key stakeholders in that review process ensures performance measurement stays collaborative, informed, and aligned with strategic goals.
The next section breaks down the Professional Services Performance Stack, the five categories of KPIs that allow firms to monitor financial performance, delivery execution, resource efficiency, client health, and talent growth in one integrated framework.
Trap alert: 3 KPIs that look healthy but hide risk
The two types of professional services KPIs: Leading vs. lagging indicators
Why the leading/lagging split is the most important framework in PS metrics
Most PS reporting is built almost entirely on lagging indicators, which means leadership is working with a picture of the business that is already six to eight weeks old. Lagging KPIs tell you the score.
Leading KPIs tell you whether you'll win the next game.
A PS firm running on lagging indicators alone is effectively flying blind for six to eight weeks at a time.
Leading indicators require more operational discipline to collect, but the competitive advantage is disproportionate: firms that surface problems early can act on them while others are still waiting for confirmation.
The PS Leading vs. Lagging Map
Which KPIs to prioritize first?
The right starting point for professional services KPIs depends on organizational size.
- Under 50 people: Start with financial and delivery lagging KPIs. Build reporting discipline first and add leading indicators once a weekly review cadence is in place.
- 100+ consultants: Both layers need to run simultaneously. Lagging metrics for executive reporting, leading metrics for operational decisions.
The professional services KPI operating system
Professional services organizations that consistently hit margin and delivery targets treat KPIs as an operating system, not a reporting layer. Instead of tracking isolated metrics, they run a structured framework that connects delivery signals, financial outcomes, client health, and staffing capacity.
A practical KPI operating system usually follows five steps.
1. Separate leading and lagging indicators
Identify which metrics predict outcomes (leading) and which confirm results (lagging). Leading indicators such as utilization forecasts or milestone completion rates reveal delivery risk weeks before financial results change.
- What done looks like: Dashboards clearly distinguish predictive signals from outcome metrics.
- Common mistake: Relying only on revenue and utilization metrics that describe past performance.
2. Build the five KPI layers
Group metrics into five categories: financial health, delivery execution, resource utilization, client health, and talent capacity.
- What done looks like: Every KPI fits clearly into one of these layers.
- Common mistake: Mixing unrelated metrics in a single executive dashboard.
3. Establish a weekly operating cadence
Review leading indicators weekly and lagging indicators monthly or quarterly.
- What done looks like: Delivery leaders and finance review the same KPI signals on a consistent cadence.
- Common mistake: Reviewing KPIs only during quarterly business reviews.
4. Assign ownership for every KPI
Every metric should have a clear operational owner responsible for monitoring the signal and initiating corrective action.
- What done looks like: Finance owns financial metrics, delivery owns execution metrics, and CS owns client health metrics.
- Common mistake: Dashboards with shared ownership where no one is accountable for changes.
5. Connect KPI signals to delivery systems
KPIs should update directly from project management, time tracking, and resource planning systems.
- What done looks like: Utilization forecasts, milestone progress, and budget consumption update automatically.
- Common mistake: Manually aggregating metrics across disconnected spreadsheets.
5 financial KPIs for professional services firms
Financial KPIs tell you whether a PS organization is generating value commensurate with its cost structure.
They connect delivery execution to financial outcomes, revealing whether growth is translating into sustainable margin and cash flow.
Understanding project-level profitability allows project managers to take a more strategic, business-like role and be directly accountable for financial outcomes.
Managing cash flow is equally critical, supporting ongoing operations, enabling client risk assessment, and keeping billing and collections on track.
The five metrics below are the ones CFOs and PS leaders debate most often, and the ones that most directly determine whether a services business scales profitably or simply grows revenue while eroding margin.
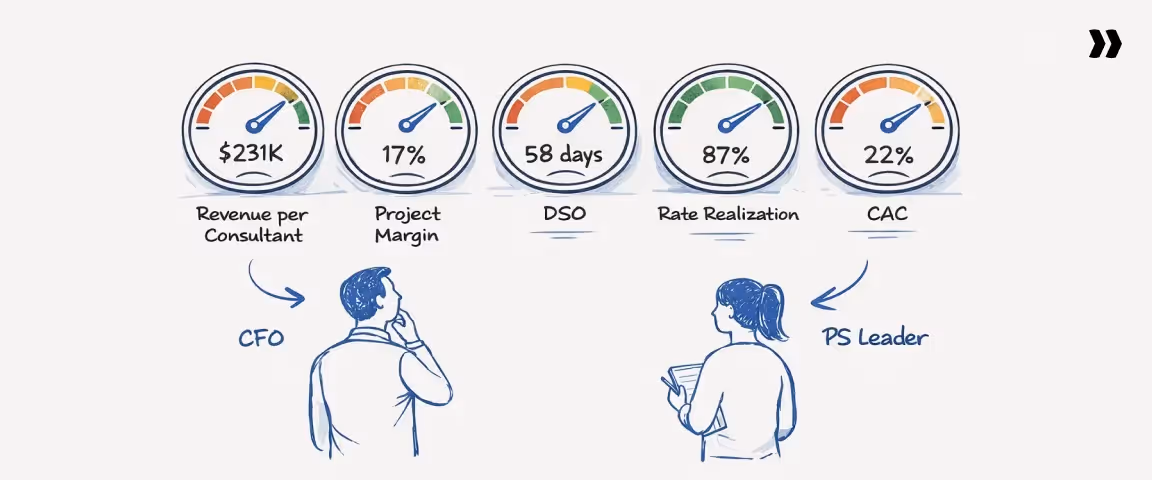
1. Revenue per employee / revenue per consultant
Revenue per consultant measures how much revenue each billable professional generates over a given period, reflecting the combined impact of utilization, billing rates, project mix, and delivery efficiency.
The denominator refers specifically to billable employees — those whose time is directly charged to clients.
Understanding their number and utilization is essential for capacity planning, resource management, and revenue forecasting. A sustained decline typically signals:
- Falling utilization or increased bench time
- Lower billing rates or discounting pressure
- A shift toward lower-value project mix
Industry benchmarks range from $150K–$350K per consultant annually, with top performers often exceeding $300K depending on pricing model and delivery mix.
2. Project profitability / project margin
Project profitability measures whether individual engagements generate sufficient margin after delivery costs, and is one of the clearest indicators of whether project execution aligns with pricing assumptions and each project's financial performance.
Project costs include billable labor, contractor spend, and project-specific expenses.
In most professional services environments, 15–20% net project margin is the minimum threshold for sustainable growth.
Common drivers of margin erosion:
- Scope creep and late-stage change requests
- Inaccurate effort and cost estimates at the point of sale
- Excessive rework during delivery
- Low utilization on partially staffed engagements
3. Days sales outstanding (DSO)
Days Sales Outstanding measures how quickly a firm collects payment after invoicing.
While often treated as a billing metric, DSO is primarily a cash flow indicator reflecting operational discipline across sales, delivery, and finance.
Effective billing and collections processes, alongside client risk assessment, are critical for keeping it healthy.
DSO above 60 days signals operational friction. Common causes:
- Delayed invoicing after project milestones
- Client approval bottlenecks in finance teams
- Billing disputes from unclear contract terms
Improving DSO requires coordination across project delivery, invoicing, and client finance teams.
4. Average hourly / bill rate
Average bill rate represents the price charged per billable hour, reflecting market positioning, resource mix, and service complexity.
The more important metric is rate realization: how much of the planned rate is actually achieved during billing.
Rate realization directly impacts the actual revenue recognized by the firm, determining the true amount earned relative to what was projected.
Firms tracking average bill rate without monitoring rate realization consistently overlook:
- Hidden discounting patterns by account or region
- Write-downs applied during delivery without commercial review
- Revenue leakage that only becomes visible at project close
5. Client acquisition cost (CAC)
Client acquisition cost measures the total cost of winning a new client, including sales salaries, marketing spend, pre-sales consulting effort, and proposal development costs.
Business development activities and marketing and sales efforts are key drivers of CAC, directly affecting how efficiently new clients are identified, engaged, and converted.
Because services engagements involve complex buying processes and high-touch delivery models, CAC can represent a meaningful portion of the first contract's value. Key benchmarks:
- A CAC-to-lifetime-value ratio above 3:1 is considered healthy for most PS organizations
- Rising CAC without corresponding margin improvement signals unsustainable growth
Tracking CAC alongside project profitability ensures new business contributes to sustainable growth rather than compressing the margins it was meant to support.
Benchmark scorecard: Financial KPI benchmarks for professional services firms
These benchmarks are drawn from SPI Research's Professional Services Maturity Benchmark and industry composite data, and vary by firm size, segment, and geography
5 project delivery KPIs for professional services
Typically, the project manager is responsible for monitoring and acting on delivery KPIs to ensure projects stay on track and meet financial targets.
A project that begins with a projected 20% margin can easily finish closer to 8% if delivery signals are not monitored while work is underway.
The professional services team is evaluated using specific KPIs and metrics that measure performance, such as billable utilization, revenue, and profit margins, positioning the team as a strategic operational unit whose success can be tracked through key performance indicators.
Unlike financial KPIs, which typically appear after projects close, delivery metrics reveal whether execution is staying aligned with the plan.
They show whether scope is expanding, timelines are slipping, or staffing assumptions are drifting.
When tracked consistently, these metrics allow teams to intervene early and protect both client outcomes and project profitability.
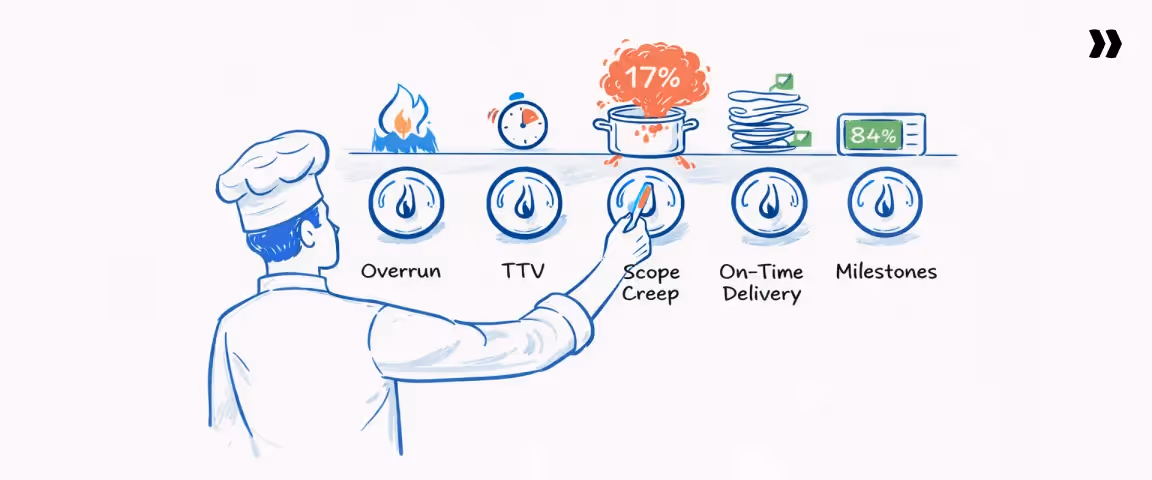
1. Project overrun rate
Project overrun rate measures the percentage of projects that exceed their planned budget, timeline, or both. It captures how frequently delivery deviates from the original plan.
Overruns typically occur when project scope expands beyond original assumptions or when delivery effort exceeds estimates.
Weak change management processes and poorly defined milestones often amplify the problem.
Industry benchmarks suggest that top-performing professional services firms keep project overrun rates below roughly 15%, while higher rates indicate systemic issues in scoping, estimation, or project governance.
2. On-time delivery rate
On-time delivery rate measures the percentage of projects or milestones completed on or before the agreed delivery date.
While it appears operational, this metric has strong implications for client relationships. Delivery delays often trigger client frustration, escalate costs, and weaken renewal probability.
Leading professional services organizations typically maintain on-time delivery rates above 85%, which reflects strong milestone governance and realistic delivery or project planning.
3. Scope creep rate
Scope creep rate measures how much the actual delivery effort expands beyond the original scope defined in the statement of work (SOW).
Since additional work is often delivered without corresponding revenue adjustments, unmanaged scope creep quietly erodes project margins.
One practical way to measure scope creep is through effort variance.
A rising scope creep rate usually signals weak change order discipline or unclear scope definitions.
Organizations that consistently monitor this metric often discover that margin erosion originates not in pricing, but in untracked delivery expansion.
4. Time-to-value (TTV)
Time-to-value measures the time between contract signature and the point at which the client achieves the first meaningful outcome from the engagement.
In SaaS implementation and onboarding environments, this might mean a system going live, the first automated workflow running successfully, or the first measurable operational improvement.
Shorter TTV correlates strongly with client satisfaction and renewal likelihood.
When customers experience value early, confidence in the engagement increases and internal champions gain support within their organizations.
Because of this relationship, many SaaS-focused professional services teams treat TTV as one of the most important delivery KPIs.
5. Milestone completion rate
Milestone completion rate measures the percentage of scheduled milestones completed on time within a defined window, often tracked weekly or over a rolling 30-day period.
Unlike end-of-project metrics, milestone tracking provides an early signal of delivery health. When milestone completion begins slipping, it usually indicates emerging issues in resourcing, scope clarity, or coordination between teams.
Organizations that monitor milestone completion weekly often identify at-risk projects three to four weeks earlier than those relying on final project status metrics.
KPI health check: Project delivery diagnostics
4 resource utilization KPIs for professional services
Utilization is the most watched metric in professional services and one of the most misunderstood.
Most firms track a single utilization percentage and treat it as a proxy for delivery performance. In reality, that number only shows a snapshot of how busy consultants were during a specific period.
What professional services organizations actually need is a utilization system that reveals how planned capacity, real work performed, and billable output relate to each other.
Establishing realistic utilization targets for both individuals and teams within this system helps organizations manage resource efficiency and track progress more accurately.
When these signals are tracked together, leaders can identify capacity gaps, forecasting problems, and revenue leakage much earlier.
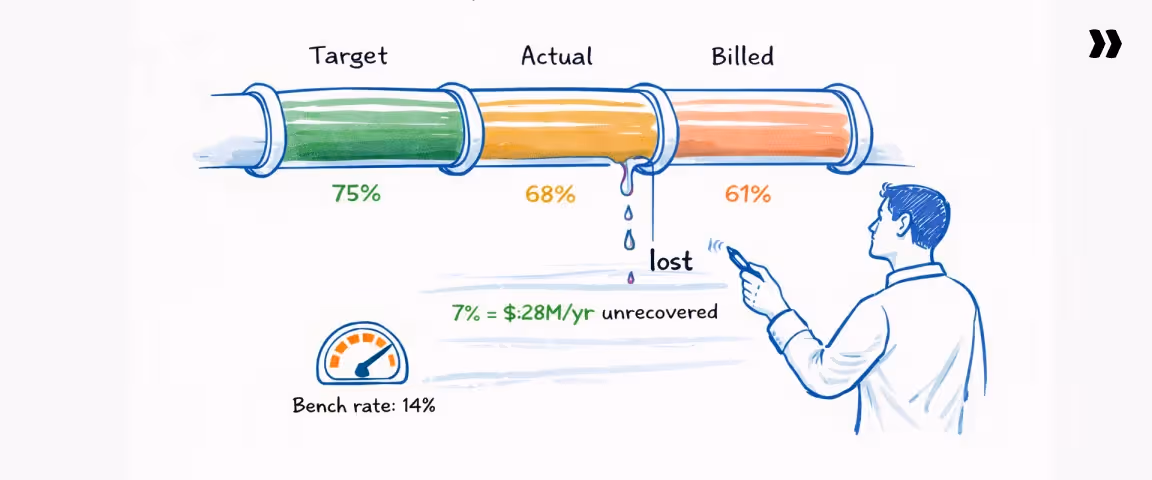
1. Billable utilization rate
Billable utilization rate measures how much of a consultant’s available working time is spent on billable client work.
This metric appears straightforward, but its meaning changes depending on which version is being measured.
Most professional services teams operate with three utilization views:
- Target utilization: The utilization level the firm plans for when forecasting revenue and staffing (often around 70–80% depending on role)
- Actual utilization: The percentage of available hours consultants actually spend on billable work during a period
- Billed utilization: The portion of billable hours that ultimately appear on client invoices.
Tracking all three reveals where revenue leaks occur. A healthy utilization strategy aligns staffing plans, delivery execution, and billing outcomes.
2. Available hours vs. productive hours
Available hours represent the total working time consultants are expected to contribute during a period, excluding holidays and approved leave.
Productive hours refer to time spent performing meaningful delivery work, whether billable or internal activities that contribute directly to client outcomes or firm capability.
The difference matters because consultants can appear highly utilized while still spending significant time on activities that do not generate revenue or measurable value.
Internal meetings, administrative work, internal coordination, or unbillable rework can reduce productive capacity.
For example, a team showing 85% utilization based on logged hours may translate into only 65–70% productive output once non-delivery effort is considered.
Monitoring productive utilization helps leadership understand whether capacity is translating into real delivery progress and margin.
3. Resource allocation accuracy
Resource allocation accuracy measures how closely planned staffing assignments match the work that consultants ultimately perform.
It reveals whether the firm’s forecasting and staffing processes are functioning reliably.
One way to evaluate it is by comparing planned effort to actual effort across projects or phases.
When the gap between planned and actual allocation regularly exceeds 10–15%, it usually indicates deeper forecasting problems.
These may include inaccurate pipeline projections, shifting project scope, or weak coordination between sales commitments and delivery capacity.
Improving resource allocation accuracy helps firms balance staffing earlier and reduces both project overruns and unexpected bench time.
4. Bench rate / bench time
Bench rate measures the percentage of time consultants spend without active project assignments. It reflects the gap between available delivery capacity and actual demand.
Some bench time is inevitable in professional services because projects start and end at different times. However, sustained idle capacity can quickly affect margin.
Many firms treat bench rates above roughly 15% for more than two consecutive weeks as a warning signal that delivery demand and staffing plans are misaligned.
When managed deliberately, bench time can still create value. Organizations often use these periods for training, internal process improvements, product development support, or pre-sales activities that strengthen future delivery.
The utilization equation
Most professional services teams track a single utilization number. High-performing teams track three interconnected signals.
The gap between actual utilization and billed utilization represents revenue that delivery teams generated but did not capture.
Even a small gap becomes meaningful at scale.
A difference of seven percentage points on a 100-consultant team billing at $200 per hour can translate into millions of dollars in unrecovered annual revenue if not addressed through improved billing discipline and scope management.
5 client health KPIs for professional services
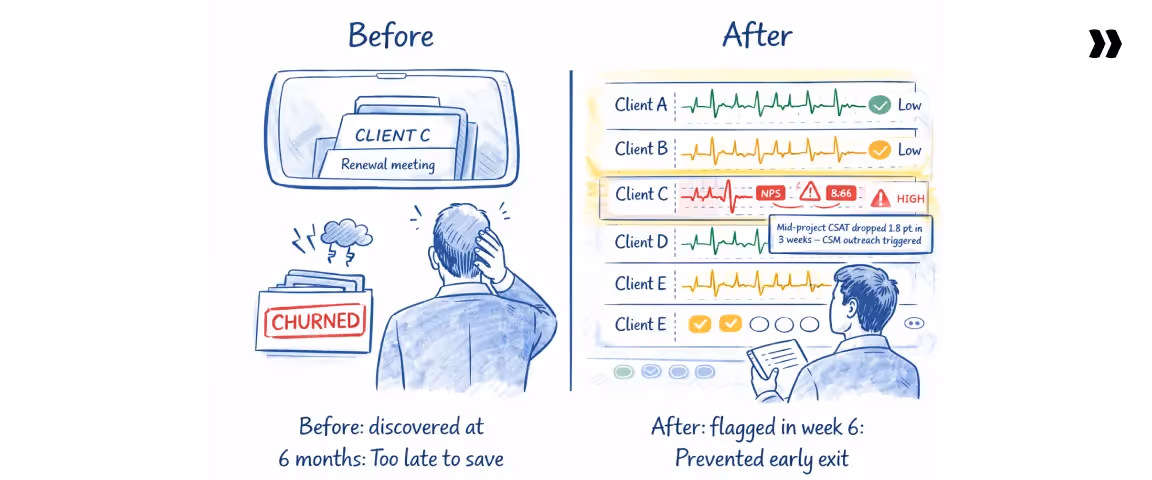
In professional services, client health KPIs function as the earliest warning system you have. Measuring how satisfied clients are during delivery is crucial, as a client who is unhappy halfway through delivery rarely becomes satisfied at renewal.
The signals appear months earlier, often during the middle stages of a project when expectations, timelines, and outcomes start to diverge.
Managing client expectations throughout the engagement is essential to ensure successful outcomes and avoid misalignment that can impact satisfaction and project results.
The challenge is that most firms only measure client sentiment at the end of the engagement. By that point the project is complete, the delivery team has moved on, and the opportunity to correct course has already passed.
Healthy professional services organizations measure client health in-flight.
They track sentiment while delivery is still underway, link that feedback to operational metrics such as milestone completion and time-to-value, and treat changes in client perception as early indicators of renewal risk or expansion opportunity.
Firms that nurture positive client relationships and focus on positive client relationships throughout the engagement can improve overall client satisfaction, which is closely tied to profitability, project margins, and long-term organizational performance.
1. Client satisfaction score (CSAT): Mid-project pulse
Client Satisfaction Score (CSAT) measures how satisfied a client is with delivery at a given point in time, usually on a 1–5 or 1–10 scale.
In many professional services organizations, CSAT is collected only once at the end of the project.
That approach produces useful marketing quotes but very little operational insight.
End-of-project surveys confirm whether the engagement succeeded or failed, but they rarely help teams prevent problems while the work is underway.
The operational value of CSAT appears when it is collected during delivery, not after it.
To achieve high CSAT scores, it is essential to provide exceptional customer service throughout project delivery, as this directly impacts client satisfaction and retention.
Many mature PS teams now run mid-project CSAT pulses at key stages, often around 30%, 60%, and 80% project completion.
These checkpoints allow delivery leaders to identify misalignment early and intervene before dissatisfaction spreads across stakeholders.
A one-point drop in mid-project CSAT often correlates with significantly lower renewal or expansion probability, because it usually reflects unresolved delivery friction rather than isolated feedback.
2. Net promoter score (NPS): Post-go-live
Net Promoter Score (NPS) measures how likely a client is to recommend a company’s services to others. The metric is calculated by subtracting the percentage of detractors from the percentage of promoters based on responses to the question:
“How likely are you to recommend us to a colleague or peer?”
In professional services environments, NPS behaves differently than in product-led SaaS companies. In SaaS, NPS typically reflects product satisfaction.
In services, it reflects the combined experience of delivery quality, communication, and perceived value. Exceptional customer service is a key driver of higher NPS, as clients who receive outstanding support and attention are more willing to recommend the firm to others.
Because of that, many firms collect NPS after a major delivery milestone or go-live event, when clients have experienced the full implementation or consulting engagement.
An NPS below roughly 30 often indicates delivery inconsistencies or expectation misalignment within a professional services practice.
3. Churn rate
Churn rate measures the percentage of clients that stop working with a firm during a given period.
While churn is widely tracked in SaaS businesses, its implications are different in professional services. When a services client churns, the firm typically loses more than recurring revenue.
Analyzing contract renewal data is crucial for identifying clients who may be at risk of churning, allowing firms to proactively address issues and improve retention.
Churn also removes future project opportunities, cross-sell potential, and referrals into new accounts.
Because many professional services firms grow through reputation and referrals, the downstream impact can be larger than the lost contract value alone.
Top-performing professional services firms typically maintain annual churn below roughly 8%, though the acceptable level varies depending on project structure and contract duration.
4. Referenceable customers
Referenceable customers represent the percentage of clients who are willing to act as references, provide case studies, or participate in reference calls during sales cycles.
This metric rarely appears in traditional KPI dashboards, yet it provides a powerful signal about delivery quality and customer confidence.
When clients consistently agree to reference calls or case studies, it indicates that delivery outcomes are strong enough for them to publicly endorse the relationship.
Conversely, a low referenceable rate often signals underlying dissatisfaction that may not yet appear in formal surveys.
Many high-performing firms aim to maintain referenceable customer rates above roughly 30% of their active client base.
5. Expansion revenue rate
Expansion revenue rate measures the percentage of revenue generated from existing clients beyond the initial scope of work.
Expansion revenue can include follow-on implementations, additional consulting engagements, managed services extensions, or increased scope within ongoing programs.
High-performing professional services firms often generate 25–40% of their revenue from client expansions.
This pattern reflects strong delivery relationships and a consistent ability to identify additional value opportunities for clients.
Expansion revenue connects directly to earlier delivery signals. Faster time-to-value, high mid-project CSAT, and strong milestone completion rates all increase the likelihood that clients invest further in the relationship.
What client health looks like with systematic KPI tracking
4 talent and growth KPIs for professional services firms

Professional services firms are fundamentally talent and resource constrained businesses. Revenue growth depends directly on the availability, capability, and stability of delivery teams.
When talent signals are monitored alongside financial and delivery KPIs, leaders gain a clearer view of whether the organization can support the growth it is pursuing.
Talent KPIs are the most under-tracked category in professional services until something breaks.
A PS leader loses two or three senior consultants in a short period, delivery schedules tighten overnight, and the team suddenly discovers that staffing capacity cannot support the projects already sold.
By that point the early indicators have usually been visible for months. Rising workload pressure, slow hiring cycles, declining revenue productivity, and growing pipeline commitments all appear long before delivery capacity collapses.
Effective talent management is also critical for controlling labor costs.
High turnover, underqualified staff, and mistakes can inflate labor costs, so investing in training, certifications, and mentorship programs helps optimize expenses and improve productivity.
Tracking these talent KPIs also informs the firm's growth strategy by providing actionable insights into workforce efficiency and future capacity.
1. Employee turnover rate
Employee turnover rate measures the percentage of employees who leave the organization during a given period.
In professional services environments, turnover has a direct operational impact because every departure removes billable capacity.
Unlike product businesses where knowledge can remain embedded in systems, services firms depend heavily on individual expertise and client relationships.
Turnover above roughly 15% annually often signals delivery risk rather than just an HR concern. Replacing experienced consultants takes time, and the effect compounds through several stages:
- Recruiting and interview cycles
- Onboarding and internal training
- Ramp-up time before consultants reach full billable productivity
In many firms, the combined impact results in six to nine months of reduced delivery capacity per departure, especially for senior or specialized roles.
2. Time-to-hire (talent acquisition speed)
Time-to-hire measures how long it takes to fill an open role, typically calculated from the moment a position is approved to the day a candidate accepts the offer.
For billable consultant roles, hiring speed directly influences revenue capacity. When a role remains unfilled, the organization is effectively operating with less delivery capacity than planned.
Many professional services organizations consider 45 days or less a healthy hiring timeline for billable roles. Beyond that threshold, pipeline commitments begin to exceed staffing capacity.
The revenue cost of an open role can be estimated using the consultant’s expected billable output. For example:
- A consultant expected to generate $200,000 in annual billable revenue produces roughly $16,700 per month.
- Leaving that role open for three months effectively reduces potential revenue capacity by about $50,000 before the new hire even begins onboarding.
3. Revenue per headcount
Revenue per headcount measures how much revenue the organization generates relative to the total number of employees.
This metric provides a clearer signal of organizational leverage than headcount growth alone. A firm can increase headcount significantly while revenue grows slowly, creating hidden productivity problems that only become visible in financial margins later.
When revenue per headcount begins to decline, it usually points to one of several structural issues:
- Hiring ahead of confirmed demand
- Reduced utilization or delivery productivity
- Increased administrative or non-billable roles
- Weak alignment between sales pipeline and delivery capacity
Tracking this KPI over time helps leadership evaluate whether growth is being achieved through better delivery productivity or simply larger teams.
4. Headcount vs. pipeline ratio
Headcount vs. pipeline ratio compares available delivery capacity with expected demand from the sales pipeline.
The metric can be expressed conceptually as:
The purpose is to determine whether the organization has the resources to deliver the work it expects to sell.
Misalignment between capacity and pipeline creates two different types of risk:
- Bench risk when hiring outpaces sales pipeline demand, leaving consultants underutilized.
- Delivery risk when sales commitments exceed available staffing, forcing teams to stretch resources across too many projects.
Healthy organizations regularly review this ratio during pipeline and staffing planning meetings so hiring decisions reflect expected delivery demand rather than reactive staffing after deals close.
Talent KPIs: What each leader cares about
Professional services KPI benchmarks: How does your firm stack up?
Here are the benchmark ranges for the professional services KPIs covered in this guide.
The figures reflect commonly cited ranges across SPI Research’s Professional Services Maturity Benchmark, TSIA State of Services, and analyst commentary from firms such as Forrester on services performance and delivery operations.
Consulting firms frequently use KPI benchmarks to evaluate their performance against peers, helping them identify areas for improvement and maintain competitiveness within the professional services industry.
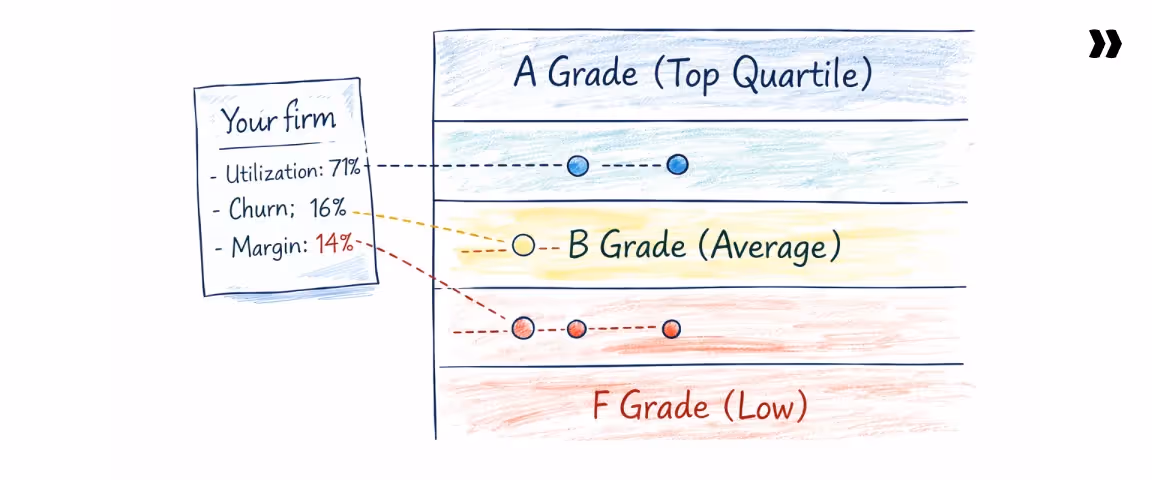
How to use these benchmarks
Remember: Benchmarks provide context, not a verdict. A utilization rate or project margin only becomes meaningful when compared with peers operating at a similar scale, delivery model, and pricing structure.
A few practical rules help make benchmarks useful:
- Compare with similar firms, not the whole industry. A 25-person consulting firm and a 500-consultant global integrator operate under very different cost structures and utilization models. Segment by size, services type, and pricing model before comparing results.
- Look at quartiles, not just averages. Industry averages often hide large performance gaps between firms. Benchmark studies typically reveal wide spreads between median and top-quartile performers.
- Revisit benchmarks annually. Professional services performance benchmarks evolve as delivery models change, especially with shifts toward subscription services, managed services, and AI-assisted delivery.
How to choose a professional services KPI tracking system
Professional services teams usually track KPIs using either spreadsheets or a dedicated professional services automation (PSA) platform.
The right choice depends on team size, delivery complexity, and how frequently leadership needs to act on operational signals.
Choose spreadsheets if:
- The services team has fewer than ~10 consultants
- Projects are simple and run sequentially rather than concurrently
- KPI reporting is mainly financial and reviewed monthly
Choose a PSA platform if:
- Your team runs many projects at the same time
- Staffing decisions depend on utilization forecasts
- Project profitability needs to be monitored while delivery is still in progress
- Leadership needs a single system connecting delivery, resource planning, and financial signals
As services organizations scale, most teams move from spreadsheet tracking to a PSA platform because delivery signals, resource planning, and financial performance become too interconnected to manage manually.
How to build a professional services KPI dashboard in 5 steps
A KPI dashboard is only as useful as the cadence at which leaders review it.
Many professional services teams invest significant effort building dashboards but look at them only during quarterly reviews, meaning the underlying operational signal has usually been visible for weeks before it surfaces in a meeting.
High-performing services organizations treat performance management dashboards as weekly operational instruments, interpreting financial outcomes alongside delivery, client, and resource signals. Integrating data visualization tools enhances the review and analysis of KPI data, making trends more apparent for stakeholders.
Building a dashboard that supports this kind of decision-making requires a structure that connects KPIs to operational rhythms, clear ownership, and escalation rules.
Data accuracy is critical, achievable through data validation tools and a centralized data repository, as the effectiveness of any dashboard depends on the quality and consistency of the underlying KPI data.
Step 1: Define your review cadence first
The cadence of review determines which KPIs belong on the dashboard. Metrics reviewed weekly serve a different purpose than those reviewed monthly or quarterly.
Most professional services firms benefit from three layers of review:
- Weekly operational reviews focus on delivery and capacity signals. These often include utilization forecasts, milestone completion rates, project overruns, and pipeline coverage.
- Monthly tactical reviews examine financial performance and operational trends. Typical metrics include project margins, revenue per consultant, rate realization, and churn signals.
- Quarterly strategic reviews assess long-term performance patterns, such as revenue growth, client expansion rates, and workforce capacity planning.
Designing the dashboard around these cadences ensures that each KPI supports a specific operational conversation rather than becoming another static report.
Step 2: Assign KPI ownership
Every KPI requires a clear owner. When metrics are collectively owned by a team, accountability tends to diffuse and issues linger longer than they should.
Effective dashboards assign responsibility at the individual level, typically aligned with functional roles:
- Financial KPIs such as revenue per consultant, project margin, and DSO are often owned by finance leadership or the CFO.
- Delivery KPIs including project overrun rate, milestone completion, and time-to-value usually sit with the VP of Professional Services or delivery operations leaders.
- Client health KPIs such as CSAT, NPS, and expansion revenue are frequently owned by customer success or account management leaders.
Ownership does not mean one person controls the outcome of the metric. It means one person is responsible for monitoring the signal and initiating action when it changes.
Step 3: Pick your leading/lagging split
The next step is deciding which metrics represent leading indicators and which confirm results after the fact.
A useful starting point is to treat professional services KPIs as a performance stack with several layers:
- Financial performance
- Delivery execution
- Resource utilization
- Client health
- Talent and capacity
Instead of tracking every possible metric at once, many organizations begin with two or three KPIs in each layer. For example:
- Revenue per consultant and project margin in financials
- Project overrun rate and milestone completion in delivery
- Billable utilization and bench rate in resource metrics
As the organization builds the discipline to review and act on metrics regularly, additional indicators can be added to refine the picture.
It's also important to focus on adjusting KPI targets based on ongoing performance analysis, ensuring that goals remain relevant and drive continuous improvement.
Step 4: Set thresholds, not just targets
A KPI without context is simply a number. What transforms a metric into a management signal is the presence of thresholds that define when action should occur.
It is crucial to set realistic KPI targets when establishing these thresholds to ensure that metrics are actionable, meaningful, and aligned with industry standards and historical data.
Most KPI dashboards use three levels of thresholds:
- Green indicates the metric is operating within expected performance ranges.
- Yellow signals emerging deviation and usually triggers closer monitoring or corrective planning.
- Red indicates that immediate intervention may be required.
For example, a billable utilization rate might use thresholds such as:
- Green: 72–78%
- Yellow: 65–72%
- Red: below 65%
With thresholds defined, the metric moves from passive reporting to a clear operational signal that prompts investigation and decision-making.
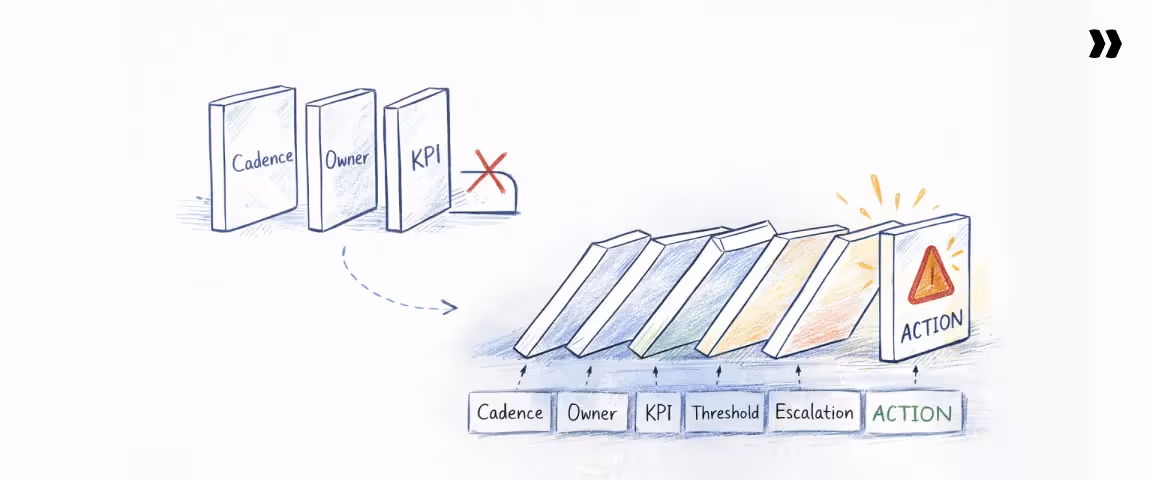
Step 5: Build the escalation logic
The final step in designing a KPI dashboard is defining what happens when a metric crosses a threshold.
Dashboards without escalation logic often become passive reporting tools. They show problems but do not define who is responsible for addressing them or how the organization should respond.
Effective KPI systems establish clear escalation paths, such as:
- Who receives alerts when a KPI enters the red zone
- Which leader reviews the issue first (for example, delivery leadership vs. finance)
- What response protocol follows, such as a project review, resource reallocation, or client intervention
KPI tracking efforts should include defined escalation protocols to ensure that issues are managed promptly and effectively, supporting ongoing alignment with business goals.
This structure ensures that the dashboard operates as a management system rather than simply a visualization of past performance.
When escalation logic is clear, KPIs shift from historical reporting toward active operational control.
Common professional services KPI mistakes (and how to avoid them)
How Rocketlane helps PS leaders track and act on KPIs

If your professional services organization manages dozens of projects simultaneously, KPI signals often live across multiple systems — project management software, time tracking platforms, finance systems, and CRM dashboards.
Rocketlane’s PSA capabilities consolidate those signals into a single operational platform, allowing delivery leaders to monitor utilization, project margin, milestone progress, and client health signals in real time.
With Rocketlane Nitro, its AI-powered agentic layer, the platform continuously analyzes delivery, resource, and financial data to surface early warnings, operational trends, and emerging risks across projects and accounts.
Instead of assembling reports after the fact, delivery leaders can monitor utilization, project margin, milestone progress, and client health signals as work unfolds.
What Rocketlane surfaces automatically
Four capability areas map directly to the KPIs covered in this guide, each surfacing operational signals that would otherwise require manual assembly across disconnected systems, namely:
Time policies agent: Monitors timesheet compliance and resource allocation across projects, with billable hours captured in the same system used for project execution. Utilization signals update continuously, giving leaders live visibility into:
- Billable utilization trends across teams
- Gaps between planned and logged hours
- Emerging bench capacity
Project governance agent: Links project budgets, delivery effort, and billing activity, updating budget versus actual comparisons automatically as work progresses. Delivery leaders gain a continuous view of:
- Project margin trends mid-engagement
- Budget consumption relative to milestone progress
- Cost exposure before invoicing cycles close
Project health monitoring: Tracks milestone completion, timeline adherence, and delivery velocity inside project workspaces. Nitro's Project Health agent, for instance, can analyze this data and surfaces risk signals when patterns suggest schedule drift, giving delivery leaders earlier visibility into:
- On-time delivery rate
- Project overrun risk
- Milestone completion trends
Account Signals: Monitors delivery patterns across projects and identifies signals indicating emerging client risk or expansion opportunity. Account teams gain earlier visibility into:
- Mid-project CSAT signals
- Churn risk indicators
- Expansion revenue opportunities
What changes for PS leaders using Rocketlane
When KPI signals are generated directly from delivery systems, the cadence of management changes. Three operational shifts tend to follow consistently across PS organizations that make the transition.
- Project overrun risk becomes visible earlier: Risk signals appear during execution, giving teams time to course-correct while options still exist.
- Utilization forecasting becomes a weekly activity: Resource allocation and time data update continuously, allowing staffing decisions to be adjusted before capacity gaps affect delivery.
- Client health signals surface well before renewal discussions: Delivery patterns reveal potential churn risk four to six weeks earlier, giving account teams time to intervene.
When these three shifts happen together, professional services performance stops being something you report on and starts being something you manage.
The signals are already in your delivery data. The question is whether your tools are reading them.
Sign up for a Rocketlane trial to see how it tracks these KPIs in a live professional services environment.
Professional services KPIs: Where to start
It’s tempting to assume that professional services performance will improve because teams track more metrics. It improves when the right metrics are reviewed frequently enough to influence delivery, staffing, and client decisions before financial results are locked in.
The PS Performance Stack in this guide covers twenty KPIs across financial health, delivery execution, resource utilization, client health, and talent capacity. Tracking all twenty on day one creates reporting overhead without improving decision-making.
Start with the Stack Rank five: utilization rate, project margin, CSAT pulse, DSO, and the 30-day utilization forecast. Build a weekly review cadence around those signals first, then add layers as the discipline to interpret and act on them compounds.
Regularly analyzing KPI data to identify trends helps spot issues early, measure the effectiveness of strategies, and drive continuous improvement across your projects.
The firms that consistently outperform their peers rarely track the most metrics. They review them sooner and act on them earlier.
Conclusion
Professional services firms rarely miss targets because they lack data. They miss them because the wrong signals are reviewed too late.
Revenue, margin, and utilization are important, but by the time they move, the underlying problem has usually been building for weeks — in staffing plans, milestone slippage, project effort variance, weak client sentiment, or hiring gaps.
That is why high-performing firms do not treat KPIs as a reporting layer. They treat them as an operating system for delivery, finance, resource planning, and client health.
The practical takeaway is simple: start smaller than you think, but review earlier than you do today.
Build your KPI framework around leading and lagging indicators, assign clear ownership, and run a weekly cadence that helps teams act before financial results harden.
If your KPI signals still live across spreadsheets, BI dashboards, PSA tools, and finance systems, your leaders are probably spending more time assembling the story than changing the outcome.
Rocketlane helps PS teams centralize delivery, resource, client, and financial signals in one system — and with Nitro, surface risks and trends early enough to act on them.
The firms that outperform do not just measure better. They intervene sooner.
To see how you can stop managing professional services performance in arrears, book a demo with the Rocketlane team to see how Rocketlane turns KPI data into operational decisions.


.webp)